Every year around Q4, our sales team starts fielding the same urgent calls from procurement managers scrambling to finalize next year’s hardware budgets. The problem is real: aluminum prices swing unpredictably, MOQs vary between stock and custom orders, and one miscalculation can blow your margins for twelve months straight.
To develop an annual procurement budget for aluminum cabinet handles, you need to combine historical spend analysis, current aluminum commodity pricing, accurate volume forecasting, and supplier negotiation strategies. A structured approach that balances stock purchases with custom OEM orders while building in contingency for raw material volatility will deliver the most reliable and cost-effective yearly plan.
Below, we break this process into four actionable areas. Each section draws on what we have learned producing handles for wholesalers and furniture factories across Southeast Asia and the Middle East over the past 18 years.
How do I accurately estimate the total unit costs for aluminum handles in my annual procurement plan?
When our production team quotes a handle, the price buyers see is just the tip of the iceberg. Many procurement managers build budgets around that single number, then get surprised by landed costs that are 15–25% higher than expected. That gap can wreck an annual plan fast.
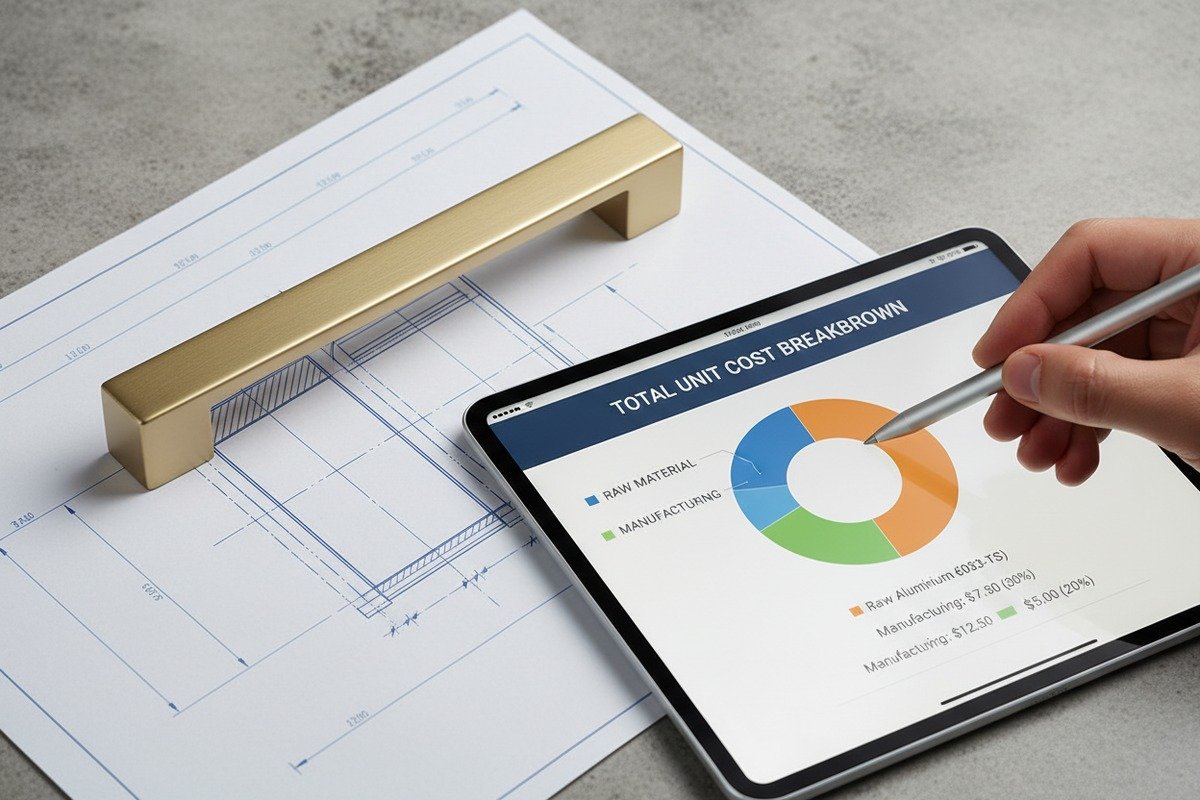
To accurately estimate total unit costs, break each handle SKU into five cost layers: raw aluminum material, manufacturing and finishing, quality inspection, packaging, and logistics including freight, duties, and insurance. Sum these layers per unit, then multiply by your forecasted annual volume for each SKU to build a reliable bottom-up budget.
Break Down the Five Cost Layers
The biggest mistake in procurement budgeting is treating the supplier's FOB price as the total cost. Here is how to think about each layer clearly.
Layer 1: Raw Material. Aluminum alloy—typically 6063-T5 1 for extruded handles—makes up 40–60% of the handle cost. Track the London Metal Exchange (LME) 2 aluminum price and your supplier's material markup. Our engineers use 6063-T5 for most furniture pull profiles because it offers the best balance of extrudability, surface finish quality, and strength.
Layer 2: Manufacturing and Finishing. This covers extrusion, CNC cutting, drilling, deburring, and surface treatment. Anodizing 3, powder coating, and brushed finishes each carry different costs. A champagne gold anodized finish, for instance, costs more than a standard silver anodized finish due to additional dyeing steps.
Layer 3: Quality Inspection. Budget for incoming inspection, in-process checks, and final QC. If you require third-party inspection 4, add that fee per shipment.
Layer 4: Packaging. Individual polybag packaging costs less than branded retail boxes. Bulk carton packing is cheapest. Confirm packaging specs early because changes mid-year disrupt cost projections.
Layer 5: Logistics. Freight, import duties, customs brokerage, and insurance make up the final layer. Sea freight 5 from Foshan to Southeast Asian ports is significantly cheaper than air freight, but lead times differ by weeks.
Sample Unit Cost Breakdown Table
| Cost Layer | Description | Estimated % of Total Unit Cost |
|---|---|---|
| Raw Aluminum (6063-T5) | LME price + supplier markup | 40–55% |
| Manufacturing & Finishing | Extrusion, CNC, anodizing/powder coat | 20–30% |
| Quality Inspection | In-house QC + optional third-party | 2–5% |
| Packaging | Polybag, carton, or branded box | 3–6% |
| Logistics (FOB to CIF) | Freight, duty, insurance, customs | 10–20% |
Use a Per-SKU Cost Card
Create a cost card for every handle SKU you plan to order. List each layer with a dollar value. This becomes your single source of truth during budget reviews. When aluminum prices shift mid-year, you only update Layer 1 and immediately see the impact on your total budget.
Also, apply variance analysis 6. Look at the past two years of actual costs versus budgeted costs. If you consistently underestimate logistics by 8%, adjust your formula. Our logistics team has found that many buyers forget to budget for port congestion surcharges, which can add $200–$400 per container during peak season.
Finally, factor in payment terms. If your supplier offers 30/70 terms (30% deposit, 70% before shipment), your cash flow timing affects your effective cost. Early payment discounts, when available, can save 1–2% annually.
How can I balance my budget between ready-to-ship stock and custom OEM handle designs?
On our production floor, we run two very different workflows side by side: stock handle lines that ship within 3–5 days, and OEM lines where custom profiles, finishes, and dimensions require 25–35 days of lead time. Most of our buyers need both—but allocating budget between them is where things get tricky.
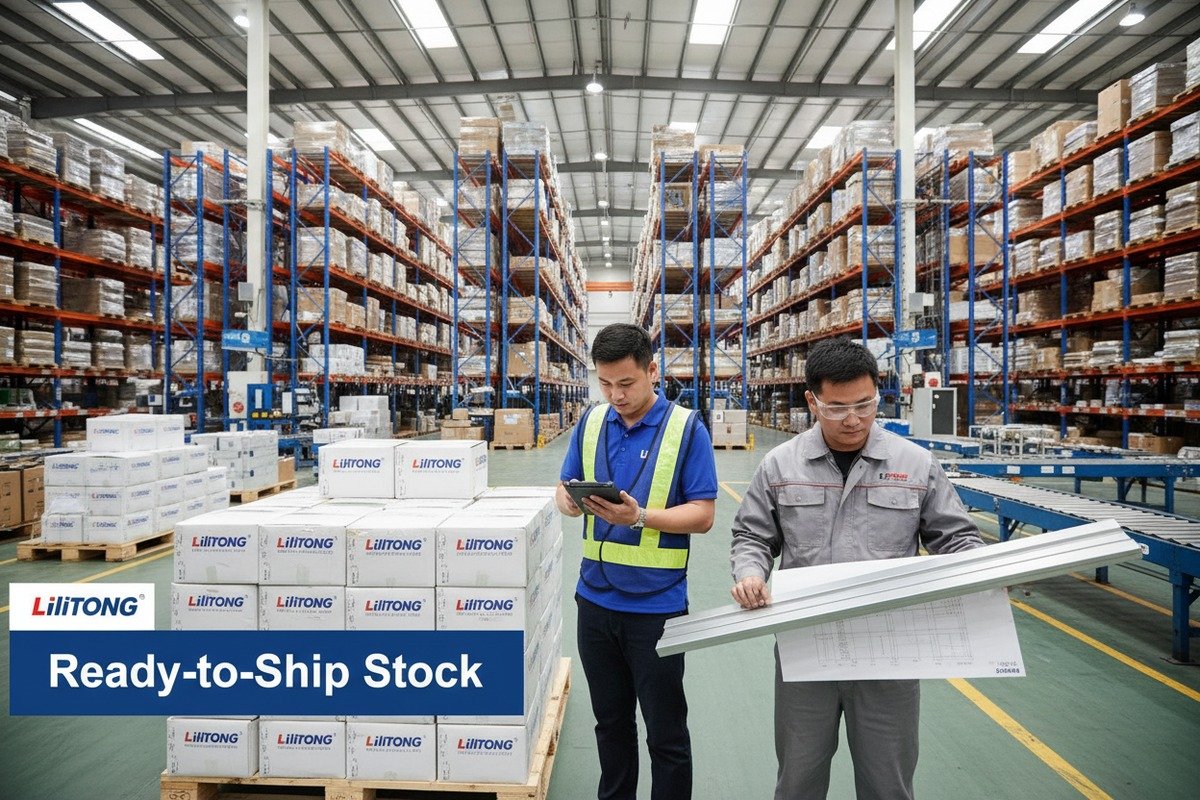
Balance your budget by allocating 60–70% to ready-to-ship stock handles for predictable, high-volume SKUs and 30–40% to custom OEM designs for differentiated or project-specific needs. Stock items offer lower unit costs and faster delivery, while OEM items command higher margins downstream but require larger MOQs and longer lead times.
Understand the Cost and Lead Time Trade-offs
Stock handles and custom OEM handles serve different purposes in your product lineup. OEM meaning 7 The budget split should reflect your sales data, not guesswork.
Stock handles—like our popular minimalist edge-mount finger pulls and sleek linear profiles—are produced in bulk with standardized dimensions and finishes. Because we amortize tooling and setup costs across large production runs, the per-unit cost is lower. Delivery is fast. Risk is low. These are your bread-and-butter SKUs.
Custom OEM handles involve new tooling (extrusion dies 8), finish sampling, and dimensional verification. The MOQ is usually higher—often 500–1,000 pieces per design—and the lead time stretches to 25–45 days depending on complexity. But these are the products that differentiate you from competitors and win project bids.
Stock vs. OEM Comparison Table
| Factor | Ready-to-Ship Stock | Custom OEM Design |
|---|---|---|
| Unit Cost | Lower (economies of scale) | Higher (tooling + setup amortized) |
| MOQ | As low as 50–100 pcs | Typically 500–1,000 pcs |
| Lead Time | 3–7 days | 25–45 days |
| Tooling Cost | None (existing dies) | $300–$1,500 per new die |
| Design Flexibility | Limited to catalog options | Fully customizable |
| Inventory Risk | Low (fast-moving items) | Higher (if demand is uncertain) |
| Margin Potential | Standard | Higher (exclusive designs) |
How to Decide the Right Split
Start with your sales history. Identify which handle SKUs sold consistently last year. Those are stock candidates. Then look at project-based or seasonal orders. Those are OEM candidates.
Here is a practical rule we share with our wholesale partners: if a SKU sells more than 2,000 pieces per year and the design is standardized, keep it in your stock budget. If a SKU is tied to a specific project, builder, or designer requirement, route it through your OEM budget.
Budget Allocation Strategy
Allocate a fixed percentage to stock replenishment—say 65%—and reserve 35% for OEM development. Within the OEM portion, set aside 5–10% as a tooling fund for new die creation. Many buyers overlook tooling costs, which range from $300 to $1,500 per custom profile. Our team typically retains the die at our facility, so buyers do not need to worry about storage, but the upfront cost must be in the budget.
Also, build in flexibility. If a custom design unexpectedly takes off in the market, you may want to convert it to a stock item mid-year. Leave a small reallocation buffer—around 5% of total budget—for these shifts.
One more tip from our experience: negotiate with your supplier to allow partial shipments on OEM orders. Instead of receiving 5,000 pieces at once, take 1,500 initially and schedule the rest across quarters. This reduces your warehousing costs and cash flow pressure.
What strategies should I use to mitigate the impact of raw aluminum price fluctuations on my yearly budget?
Over the past three years, we have watched aluminum prices on the LME swing from around $2,100 per metric ton to over $3,400, then back down again. For our buyers placing annual orders worth tens of thousands of dollars, that kind of volatility can mean the difference between a profitable year and a painful one.
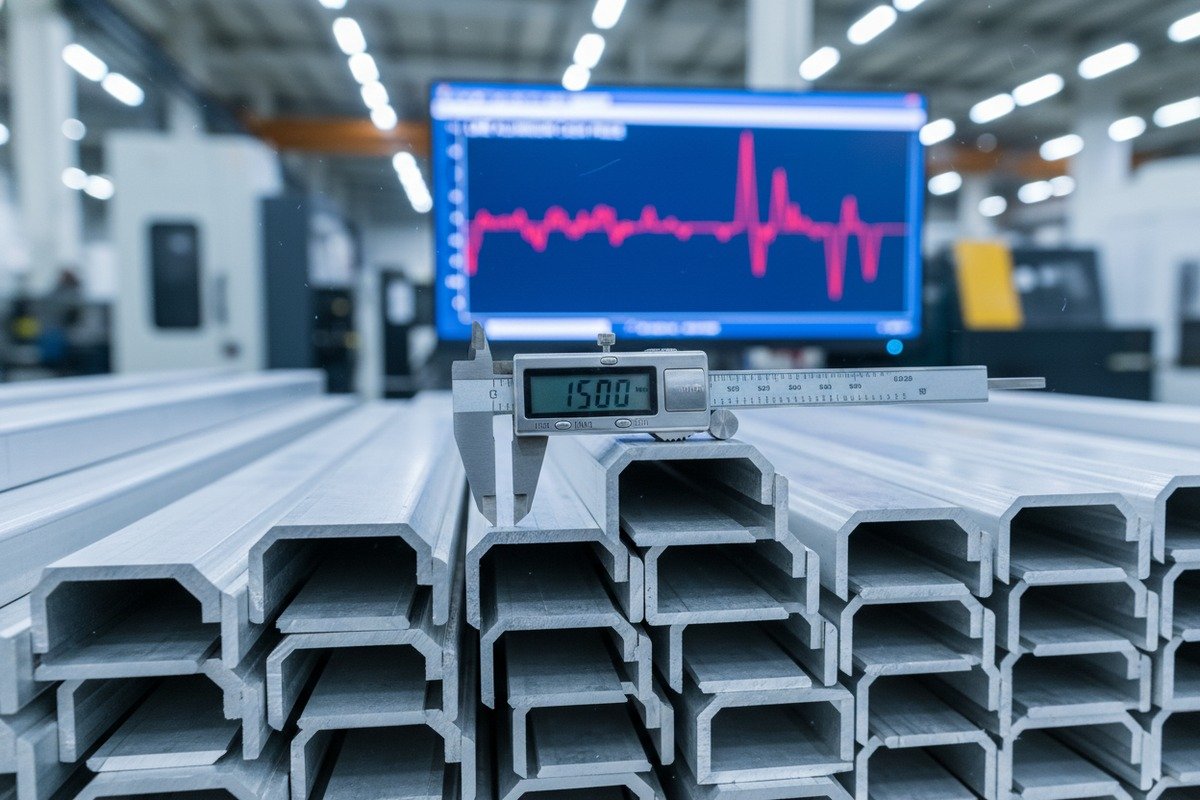
Mitigate aluminum price fluctuation impact by using three core strategies: lock in prices through fixed-price contracts for 6–12 months, stagger your orders across quarters to average out price peaks, and maintain a contingency buffer of 5–10% in your annual budget. Combining these approaches smooths cost volatility and protects your margins.
Strategy 1: Fixed-Price Supplier Contracts
The most direct hedge is a fixed-price agreement with your supplier. fixed-price contracts 9 This works best when aluminum prices are at or below their 12-month average. You agree on a unit price that holds for 6–12 months regardless of market movement.
From our side, we offer price-lock agreements to long-term partners who commit to minimum annual volumes. The trade-off is clear: you get price certainty, and we get demand certainty. Both sides reduce risk.
However, understand the limitation. If aluminum drops significantly after you lock in, you pay more than the spot market rate. That is the cost of stability. Most procurement professionals accept this because budget predictability matters more than chasing the lowest possible price.
Strategy 2: Staggered Quarterly Orders
Instead of placing one massive annual order, split your procurement into quarterly batches. This is a form of dollar-cost averaging 10 applied to procurement. You buy at Q1 prices, Q2 prices, Q3 prices, and Q4 prices. Your average cost smooths out the peaks and valleys.
This strategy also reduces inventory carrying costs and frees up working capital. You are not storing twelve months of handles in your warehouse from day one.
Strategy 3: Contingency Buffer
Always include a contingency buffer in your budget. We recommend 5–10% above your base aluminum cost estimate. If aluminum stays flat or drops, that buffer becomes available for other uses. If prices spike, the buffer absorbs the shock without forcing you to cut orders or negotiate emergency pricing.
Aluminum Price Risk Mitigation Comparison
| Strategy | Risk Reduction Level | Cash Flow Impact | Best Used When |
|---|---|---|---|
| Fixed-Price Contract (6–12 mo.) | High | Neutral (predictable payments) | Prices are at or below average |
| Staggered Quarterly Orders | Medium | Positive (spread payments) | Market is volatile or uncertain |
| Contingency Buffer (5–10%) | Medium | Slight increase in budget | Always recommended |
| Spot Market Purchasing | Low | Variable | Prices are clearly declining |
| Long-Term Volume Commitment | High | Neutral to positive | Strong supplier relationship |
Monitor the Right Indicators
You do not need to become a commodities trader. But track three things monthly: the LME aluminum spot price, energy costs in major smelting regions (China, the Middle East), and recycled aluminum scrap pricing. These three indicators give you a reliable forward view.
Our team sends quarterly market updates to key buyers, flagging significant price movements and recommending order timing. If you are not getting this from your current supplier, ask for it. Good suppliers share market intelligence because it builds trust and leads to better planning on both sides.
Consider Recycled Aluminum Options
Recycled aluminum typically costs 10–20% less than primary aluminum and requires 95% less energy to produce. For many handle applications, recycled 6063 alloy meets all performance and finish requirements. If sustainability matters to your brand—and increasingly, it does—this is a cost savings and a marketing advantage rolled into one.
How do I optimize my bulk order volume to secure the most competitive pricing from my Chinese supplier?
When we review order patterns from our partners, a clear trend emerges: buyers who plan their volumes strategically pay 8–15% less per unit than those who place ad hoc orders throughout the year. The difference is not luck—it is structure.
Optimize bulk order volume by consolidating SKUs into fewer, larger shipments, committing to annual volume agreements with tiered pricing, and coordinating order timing with your supplier's production schedule. Orders of 3,000–10,000 pieces per SKU typically unlock the best price tiers from Chinese manufacturers while keeping inventory manageable.

Understand Your Supplier's Pricing Tiers
Most Chinese aluminum handle manufacturers, including our facility in Foshan, structure pricing in tiers. The logic is simple: larger orders spread fixed costs (machine setup, die changes, quality inspection) across more units, lowering the per-piece cost.
Here is an example from a typical minimalist edge-mount pull handle:
| Order Quantity (per SKU) | Approximate Unit Price | Savings vs. Minimum Order |
|---|---|---|
| 100–499 pieces | $1.80–$2.20 | Baseline |
| 500–1,999 pieces | $1.50–$1.80 | 10–18% savings |
| 2,000–4,999 pieces | $1.25–$1.50 | 25–32% savings |
| 5,000–9,999 pieces | $1.05–$1.25 | 38–43% savings |
| 10,000+ pieces | $0.90–$1.10 | 45–50% savings |
These are illustrative ranges. Actual pricing depends on handle length, profile complexity, finish type, and current aluminum costs. But the pattern is consistent: volume drives price.
Consolidate SKUs to Hit Higher Tiers
If you carry 20 handle SKUs but order only 200 pieces each, you are paying baseline prices across the board. Instead, identify your top 5–8 SKUs by volume and consolidate orders. Can you reduce your active catalog from 20 SKUs to 12 without losing sales? If so, the remaining SKUs each get a larger share of your total volume, pushing them into better price tiers.
Our wholesale partners in Southeast Asia often do this exercise annually. They review which handle styles actually sell and cut the slow movers. The result: fewer SKUs, higher per-SKU volume, lower unit costs, and simpler inventory management.
Align Orders with Supplier Production Cycles
Every factory has busy periods and slow periods. In our experience, Q1 (January–March, post-Chinese New Year) and Q3 (July–September) tend to have more available production capacity. Placing orders during these windows may earn you priority scheduling and occasionally better pricing because the factory wants to fill capacity.
Avoid placing large orders right before major trade shows or peak construction seasons when production lines are already at full capacity. Lead times stretch, and your negotiating leverage drops.
Use Annual Volume Commitments
An annual volume commitment (AVC) is one of the strongest tools in your negotiation toolkit. You commit to a total annual volume—say, 30,000 handles across all SKUs—and in return, the supplier locks in a discounted price tier for the full year.
The key is to structure the AVC with flexibility. We typically allow partners to adjust individual SKU quantities within the committed total, as long as the aggregate volume holds. This gives you pricing certainty without locking you into rigid SKU-by-SKU forecasts.
Do Not Over-Order
There is a temptation to inflate volumes just to get a lower price. Resist it. Excess inventory ties up cash, occupies warehouse space, and carries the risk of obsolescence if design trends shift. Calculate your economic order quantity (EOQ) carefully. The sweet spot is the volume where additional savings from a larger order no longer outweigh the carrying costs of surplus inventory.
A practical guideline: if it takes more than 6 months to sell through a single order, you have probably over-ordered. Aim for 3–4 months of supply per shipment, replenished quarterly.
Negotiate Beyond Unit Price
Price is not the only lever. Negotiate payment terms (60-day net instead of 30/70), free or subsidized packaging upgrades, consolidated shipping with other product categories, and extended warranty on finish durability. These concessions reduce your total cost of ownership even if the unit price stays the same.
Our team routinely works with buyers to find creative cost-reduction solutions. Sometimes the answer is not a lower price per handle—it is a smarter shipping configuration that saves $500 per container, or a finish adjustment that cuts processing time by 20%.
Conclusion
Building a solid annual procurement budget for aluminum cabinet handles comes down to four disciplines: accurate cost layering, smart stock-versus-OEM allocation, proactive price risk management, and strategic volume optimization. Apply these consistently, review quarterly, and your budget will serve you well all year.
Footnotes
1. Provides detailed properties and applications of 6063-T5 aluminum alloy. ↩︎
2. The official LME website returned a 403 error. Wikipedia provides an authoritative overview of the London Metal Exchange. ↩︎
3. Explains the electrochemical process of anodizing for enhancing metal surfaces. ↩︎
4. Explains the definition, process, and benefits of independent third-party quality inspections. ↩︎
5. Describes sea freight as a cost-effective, high-capacity mode for international goods transport. ↩︎
6. Defines this financial tool for comparing actual versus budgeted performance. ↩︎
7. The original URL returned a 404 error. Wikipedia provides an authoritative definition of Original Equipment Manufacturer (OEM). ↩︎
8. Describes extrusion dies as crucial tools for shaping materials in the extrusion process. ↩︎
9. Defines fixed-price contracts as agreements with a set payment amount for goods or services. ↩︎
10. Explains dollar-cost averaging as an investment strategy to manage market volatility. ↩︎