
Every year around November, our planning team sits down to map out handle procurement for the next twelve months landed cost per unit 1. Without a clear budget, furniture factories and wholesalers end up overspending in some quarters and scrambling for stock in others. The pain is real: surprise price hikes, emergency air freight, and idle production lines waiting on hardware that should have been ordered weeks ago.
To develop an annual procurement budget for aluminum furniture handles, start by forecasting your total unit demand from production schedules and sales pipelines, then multiply by landed cost per handle. Allocate spending across quarters based on seasonality, supplier lead times, and inventory targets rather than dividing the total evenly by four.
Below, we walk through each step of this process contingency buffer 2. You will learn how to estimate annual spend, distribute it wisely across Q1 through Q4, plan for custom OEM development costs 3, and balance bulk buying against high-end customization needs. Let us get into the details.
How can I accurately estimate my total annual expenditure for aluminum furniture handles based on my production volume?
Many procurement managers guess their annual handle spend based on last year's invoices. That approach ignores new projects, changing SKU mixes, and shifting supplier prices. The result is a budget that looks fine on paper but falls apart by March.
To estimate annual expenditure accurately, calculate your total unit demand per handle SKU from your bill of materials and production forecast, then apply the fully landed cost per unit — including unit price, freight, duties, packaging, and a contingency buffer of five to ten percent for defects and price variance.
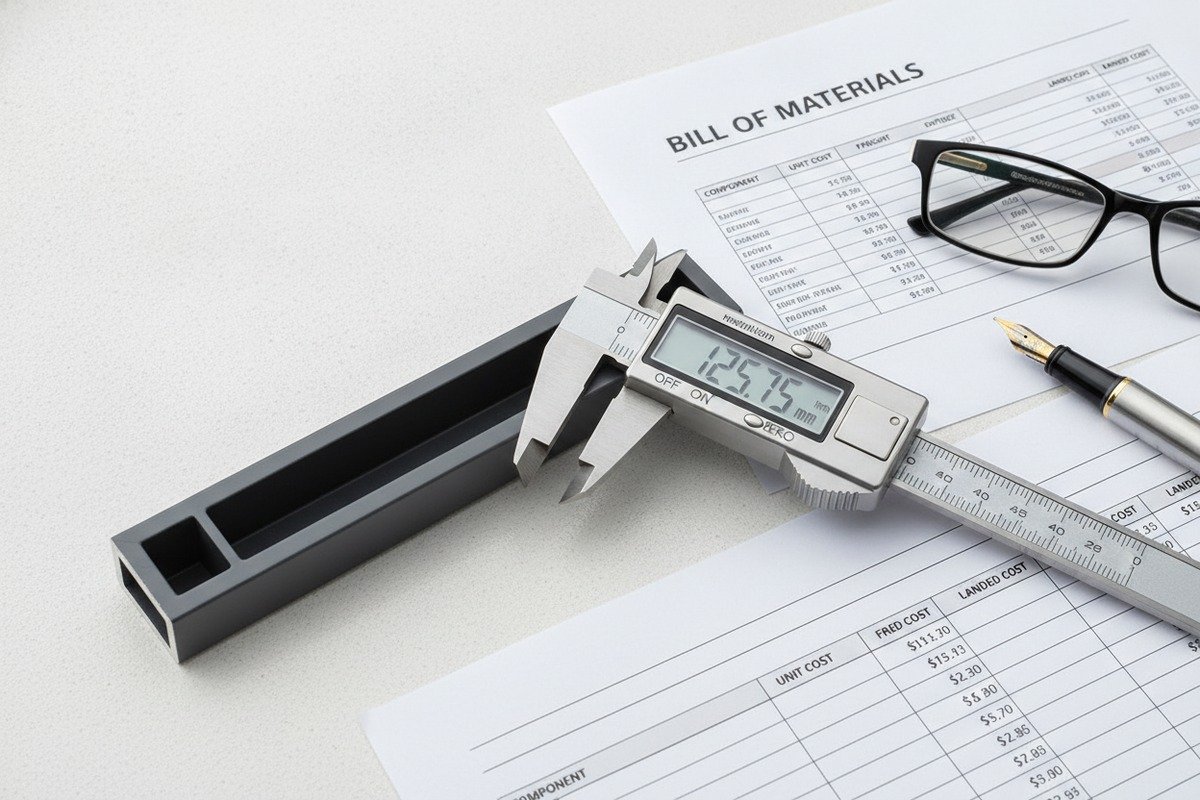
Start With Your Bill of Materials
The most reliable way to forecast handle demand is to pull the numbers directly from your product BOMs. bill of materials 4 Every cabinet, wardrobe, or drawer unit on your production schedule tells you exactly how many handles you need. If a kitchen cabinet program calls for 2,000 units and each unit uses six handles, that is 12,000 handles from one program alone.
Collect this data across all product lines. Add replacement stock for after-sales service. Add any sample or prototype quantities. The goal is a single number: total units needed for the year, broken down by SKU.
Convert Units to Spend
Once you have your unit forecast, apply cost. But use the right cost figure. Many buyers budget using only the ex-works price 5 from their supplier. That misses a lot.
| Cost Component | What It Includes | Typical Share of Landed Cost |
|---|---|---|
| Ex-works unit price | Raw material, extrusion, anodizing or powder coating, packaging | 55–65% |
| Freight and logistics | Sea freight, trucking, consolidation fees | 15–20% |
| Import duties and taxes | Country-specific tariff rates on aluminum hardware | 5–10% |
| Quality inspection | Pre-shipment checks, third-party QC if used | 2–4% |
| Contingency reserve | Defects, urgent reorders, price increases mid-year | 5–10% |
Multiply your unit forecast by the fully landed cost per handle. That gives you a realistic annual budget figure — not just a purchase order estimate.
Segment by Price Tier
Not all handles cost the same. In our production facility, a standard matte black recessed handle costs less to produce than a champagne gold anodized architectural pull with tight tolerances. Your budget should reflect this.
Split your handle requirements into tiers. Budget utility handles separate from premium decorative handles. This prevents one expensive specification from inflating your average unit cost assumption and distorting quarterly allocations.
Use Historical Data as a Sanity Check
After building your bottom-up forecast, compare it to the last two years of actual procurement spend. If the new number is 30% higher, make sure you can explain why. New product launches, market expansion into new regions, or switching from plastic to aluminum handles could all justify an increase. If you cannot explain the gap, revisit your assumptions.
What strategies should I use to distribute my procurement budget across each quarter to ensure consistent stock levels?
Splitting your annual handle budget into four equal parts sounds logical. But it almost never works. Production schedules are uneven. Supplier lead times shift. Aluminum prices move. A smarter allocation saves money and prevents stockouts.
Distribute your quarterly budget based on production ramp schedules, supplier lead times, seasonal demand peaks, and inventory carrying cost targets. Front-load spending in quarters with long-lead custom orders or anticipated price increases, and reserve a flexible buffer in Q4 for year-end replenishment and carryover stock.
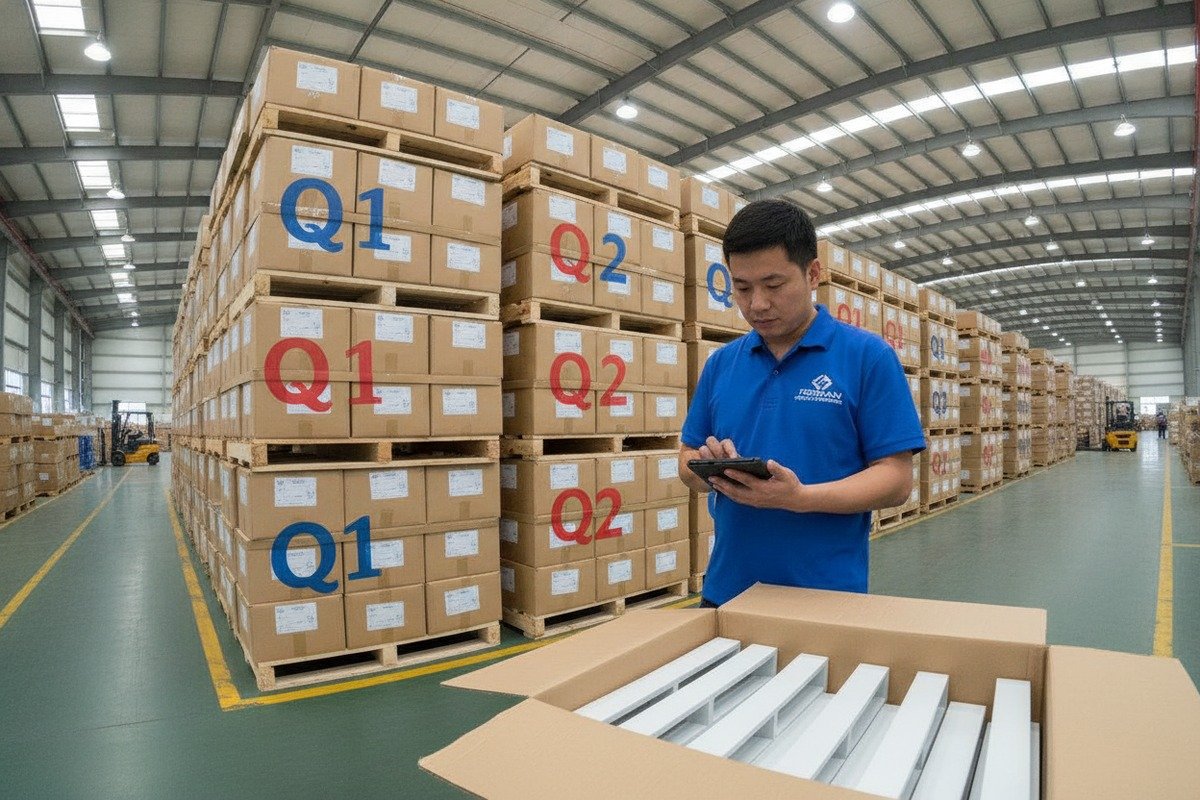
Map Your Production Calendar First
Before assigning dollars to quarters, map your production calendar. When do your biggest furniture programs start? When do your retail customers place seasonal orders? In our experience shipping to Vietnam and the Middle East, Q1 tends to be a ramp-up period after holiday slowdowns. Q2 and Q3 often carry the heaviest production load. Q4 can be a mix of finishing current orders and pre-buying for the next year.
Your quarterly budget should mirror this rhythm. If 35% of your annual handle consumption happens in Q3, then roughly 35% of your procurement budget — adjusted for lead times — should be committed in Q2 to ensure the handles arrive on time.
Account for Supplier Lead Times
This is where many buyers miscalculate. If your handle supplier needs 15 to 20 days for custom orders or 48 hours for ready-to-ship stock items, you need to place orders well ahead of your production need date. That means your spending calendar is shifted forward relative to your consumption calendar.
| Quarter | Primary Spending Purpose | Budget Allocation Range |
|---|---|---|
| Q1 | Baseline stock replenishment, early-year project launches, safety stock rebuild | 20–25% |
| Q2 | Mid-year production ramp, new product introductions, bulk order placement for Q3 peak | 25–30% |
| Q3 | Peak demand fulfillment, long-lead specialty finishes, buffer for rush orders | 25–30% |
| Q4 | Year-end replenishment, warranty and replacement stock, carryover inventory for Q1 next year | 15–25% |
These ranges are not fixed rules. They are starting points. Adjust them based on your specific production peaks and cash flow constraints.
Build a Safety Stock Policy
A quarterly budget without a stock policy is incomplete. Safety Stock Policy 6 Decide how many weeks of handle inventory you want on hand at all times. Two weeks of safety stock is common for standard handles. For custom finishes or unique profiles, you may want four weeks because replenishment takes longer.
Your safety stock target directly affects when and how much you buy each quarter. If your Q2 consumption will be high and your safety stock drops below target in late Q1, you need to pull some Q2 spending into Q1.
Plan for Price Volatility
Aluminum is a commodity 7. Its price moves with global energy costs and supply chain dynamics 8. If market signals suggest prices will rise in the second half of the year, consider front-loading some of your purchases in Q1 and Q2 to lock in lower costs. Conversely, if prices are expected to soften, a more balanced or back-loaded approach preserves cash.
We have seen buyers save three to five percent on annual handle spend simply by timing their bulk orders to coincide with favorable pricing windows. That is real money on a high-volume hardware category.
Create a Quarterly Review Cadence
No annual budget survives the year unchanged. Set a quarterly review meeting where you compare actual spend to plan, update your demand forecast, and reallocate remaining budget as needed. This keeps your plan alive and responsive.
How do I account for the additional costs of custom OEM handle development within my quarterly financial planning?
Custom handles drive differentiation. But they also drive hidden costs. When our engineering team develops a new OEM handle profile for a furniture factory client, the process involves tooling, prototyping, sampling, finish testing, and small initial production runs — all before the first bulk order ships.
Account for OEM development costs by creating a separate budget line for tooling, prototyping, samples, and initial production runs. Assign these costs to the quarter when development begins — typically Q1 or Q2 — and keep them distinct from your recurring bulk handle procurement budget to avoid distorting your quarterly spend tracking.

Separate Development Costs From Recurring Procurement
The biggest mistake procurement managers make is lumping OEM development costs into their regular handle purchasing budget. When you do that, Q1 suddenly looks 40% over budget because of a tooling charge, and Q3 looks artificially under budget. This makes quarterly tracking meaningless.
Instead, create two budget lines:
- Line 1: Recurring handle procurement — your standard and custom handles ordered in production quantities.
- Line 2: OEM development — one-time costs for new handle programs including tooling, mold charges, prototype samples, finish development, and first-article inspection.
Understand the Development Cost Components
When working with a handle manufacturer on a new OEM design, you will encounter several cost categories that do not repeat once the handle enters mass production.
| Development Cost Item | When It Occurs | Typical Frequency |
|---|---|---|
| Extrusion die or tooling charge | Before first sample | One-time per profile |
| Prototype samples | During design approval | 1–3 rounds |
| Finish development (anodizing, powder coating) | After profile approval | One-time per finish |
| First-article inspection and testing | Before mass production begins | One-time per SKU |
| Packaging design for new handle | Before first shipment | One-time per SKU |
These costs are front-loaded. You pay them before you ever receive a bulk shipment. Plan for them in the quarter when you kick off the development project.
Time Your OEM Projects Strategically
If you know you need a new handle design ready for a furniture launch in Q3, start the development in Q1. This gives you a full quarter for tooling and sampling, another quarter for design revisions and approval, and your handles arrive in time for production.
From our experience developing custom profiles with a 3-to-7-day turnaround on custom orders, even fast development cycles need planning. Rush tooling costs more. Rush sampling compresses your review time. Starting early saves money and reduces mistakes.
Amortize Tooling Over Expected Volume
Some suppliers, including our team at LiliTONG, offer to amortize tooling 9 costs into the unit price when the buyer commits to a minimum annual volume. This shifts the tooling expense from a lump-sum payment in Q1 to a small per-unit surcharge spread across the year. It smooths your quarterly cash flow and makes the development cost easier to absorb.
Ask your supplier about this option. It works well when you are confident in your annual volume forecast for the new handle.
Budget for Iteration
New handle designs rarely finalize in one round. Plan for two to three sampling iterations. Each iteration may involve minor profile adjustments, finish changes, or tolerance corrections. Budget a small cushion — typically 10 to 15 percent above the quoted development cost — to absorb these revisions without needing a mid-quarter budget adjustment.
How can I optimize my budget by balancing bulk purchases of ready-to-ship handles with my need for high-end customization?
This is the tension every furniture factory and wholesaler faces. Bulk ready-to-ship handles are fast and cheap. Custom handles set your products apart. Getting the ratio wrong either drains your budget or leaves your product line looking generic.
Optimize your budget by using ready-to-ship handles for high-volume standard applications and reserving custom orders for flagship or premium product lines. Aim to cover 60 to 70 percent of your annual handle volume with stock items at lower unit costs, and allocate the remaining 30 to 40 percent of your budget to custom specifications where design differentiation delivers measurable value.

Define Your Handle Portfolio
Before you can balance bulk versus custom, you need to see your full handle portfolio clearly. List every handle SKU you use. For each one, note the annual volume, whether it is a standard or custom specification, its unit cost, and which product line or customer it serves.
This exercise usually reveals that a small number of standard handle SKUs account for most of your volume, while a longer tail of custom or specialty handles drives a disproportionate share of your per-unit cost. That insight is the foundation for your optimization strategy.
Apply the 70/30 Rule as a Starting Framework
In our facility, we ship over 300 tons of ready-to-ship inventory each year. The buyers who manage their budgets most effectively tend to follow a pattern: roughly 70% of their handle units come from standard stock, and 30% come from custom orders. The budget split is different — custom handles cost more per unit, so the 30% of volume might consume 40 to 50% of the budget. But the principle holds.
Stock handles give you speed. Our 48-hour shipping on in-stock items means you never wait for your most common handles. Custom handles give you differentiation. The key is knowing which handles need to be custom and which do not.
Negotiate Volume Discounts on Stock Items
The biggest budget lever for stock handles is volume pricing 10. Suppliers — including us — offer tiered pricing based on order quantity. The more you consolidate your standard handle purchases into fewer, larger orders, the lower your unit cost drops.
Here is a simplified example of how volume tiers can affect your annual budget on a single standard handle SKU:
| Annual Volume (pieces) | Unit Price Tier | Annual Cost |
|---|---|---|
| 5,000 | Standard price | Baseline |
| 10,000 | 5–8% discount | 5–8% savings |
| 25,000 | 10–15% discount | 10–15% savings |
| 50,000+ | Negotiated annual contract rate | Highest savings tier |
Even a 10% discount on your highest-volume handle SKU compounds into significant annual savings. Use those savings to fund your custom handle development without increasing total budget.
Consolidate Suppliers to Unlock Better Terms
Working with fewer suppliers gives you more leverage. If you split your handle orders across five suppliers, none of them sees enough volume to offer their best pricing. Consolidating to one or two qualified suppliers — one for stock, one for specialty — concentrates your spend and unlocks better terms.
This also simplifies your procurement process. Fewer purchase orders, fewer quality inspections, fewer logistics coordinators. The administrative savings are real even if they do not show up on a unit price spreadsheet.
Use Custom Orders for Strategic Value Only
Not every handle needs to be custom. A matte black recessed pull that matches a widely available specification does not need a dedicated OEM tooling run. Save your custom budget for handles that genuinely differentiate your product — a unique champagne gold anodized profile, a proprietary geometric channel design, or a handle engineered to a specific mounting dimension that competitors cannot easily replicate.
Ask yourself: does this custom handle increase the sell-through or margin of the furniture it is installed on? If yes, the custom investment pays for itself. If not, switch to a stock alternative and redirect the budget.
Plan Custom Orders Early in the Year
Custom handles have longer lead times. If you wait until Q3 to start development, you may not have handles ready until Q4 or even Q1 of the next year. Placing custom development orders in Q1 gives your supplier the most time and gives you the most flexibility to iterate on design before peak production season.
This also helps cash flow. Spreading custom development costs across Q1 and Q2 avoids a budget crunch later in the year when your bulk stock purchases are also peaking.
Conclusion
A well-built annual procurement budget turns aluminum furniture handle purchasing from a reactive chore into a strategic advantage. Forecast demand from your BOMs, apply fully landed costs, allocate spending by quarter based on real production rhythm, and balance stock with custom wisely.
Footnotes
1. Comprehensive explanation of landed cost, including per unit calculation. ↩︎
2. Direct definition of ‘contingency buffer’ from a financial glossary. ↩︎
3. Breaks down product development costs across stages like design, prototyping, testing, and manufacturing setup. ↩︎
4. Authoritative source for definition. ↩︎
5. Authoritative government source for Incoterms definition. ↩︎
6. Explains safety stock as extra inventory to mitigate stockouts and manage demand/supply variability. ↩︎
7. Defines ‘commodity’ as an economic good or article of commerce, which aluminum is. ↩︎
8. Discusses key supply chain trends and structural shifts influencing operations and decision-making. ↩︎
9. Defines tooling amortization as spreading costs over production volume, preserving cash flow and clarifying ownership. ↩︎
10. Defines volume pricing as a strategy offering discounts for larger quantities, incentivizing bulk purchases. ↩︎