
Every year, our sales team in Foshan fields hundreds of inquiries from Vietnamese buyers asking the same question: which handle styles should they stock next season urbanization rates 1? The truth is, most buyers still rely on gut feeling and competitor copying. That approach leads to dead stock, missed trends, and wasted capital.
To forecast demand for aluminum furniture handle styles in Vietnam, combine top-down market data like urbanization rates and furniture growth projections with bottom-up signals such as SKU sell-through, e-commerce search trends, quote request patterns, and supplier export data. This hybrid approach lets you predict style, finish, and volume at a granular level.
Below, we break down the exact data sources, metrics, and methods you can use to make smarter sourcing decisions furniture growth projections 2. Each section gives you a practical framework, not just theory.
How can I analyze local Vietnamese furniture trends to choose the right aluminum handle finishes for my inventory?
When we review order histories from our Vietnamese distributors each quarter, one pattern stands out clearly: finish preferences shift faster than handle shapes e-commerce platforms 3. A buyer who ordered only brushed silver last year now wants matte black and champagne gold. Missing that shift means sitting on inventory nobody wants Construction and housing data 4.
Analyze Vietnamese furniture trends by tracking urbanization-driven housing data, monitoring e-commerce platforms like Shopee and Lazada for trending furniture aesthetics, reviewing interior design content on local social media, and cross-referencing these signals with your own historical sales data by finish type.

Why Finish Trends Matter More Than You Think
In Vietnam's furniture hardware market, the handle silhouette changes slowly inventory turnover rate 5. A minimalist bar pull remains popular for years. But the finish on that bar pull can shift in a single season Days of Supply 6. Matte black dominated urban kitchen projects in 2023. By mid-2024, champagne gold and two-tone finishes started gaining ground in Ho Chi Minh City showrooms. If your inventory is locked into one finish, you lose flexibility.
Data Sources You Should Monitor
Here are the most useful data inputs for tracking finish trends in Vietnam:
- E-commerce platforms. Search Shopee, Lazada, and Tiki for "tay nắm tủ nhôm" (aluminum cabinet handle). Sort by best-selling. Note which finishes appear in the top 20 results each month.
- Social media. Follow Vietnamese interior design accounts on Facebook, TikTok, and Pinterest. Track which kitchen and wardrobe images get the most engagement. Note the handle finishes visible in those images.
- Construction and housing data. Vietnam's urbanization rate is climbing past 40%. New apartment projects in Hanoi and HCMC often specify modern, matte-finish hardware. Track new project announcements from major developers.
- Your own order data. If you have six months or more of sales records by SKU, sort by finish. Calculate the month-over-month growth rate for each finish category.
A Simple Finish Trend Scoring Table
You can build a basic scoring model to rank finishes for your next purchase order. Here is an example:
| Finish Type | E-commerce Trend Score (1-5) | Social Media Visibility (1-5) | Your Historical Sales Growth (%) | Weighted Priority Score |
|---|---|---|---|---|
| Matte Black | 5 | 5 | +12% | 22 |
| Champagne Gold | 4 | 4 | +25% | 21 |
| Brushed Silver | 3 | 3 | -5% | 11 |
| Anodized Bronze | 3 | 4 | +8% | 15 |
| White Matte | 2 | 3 | +18% | 14 |
Weight each column based on what matters most for your market. If you sell mainly to project buyers, give more weight to construction data. If you sell online, weight e-commerce scores higher.
Regional Differences Inside Vietnam
Tier 1 cities like HCMC and Hanoi lean toward design-forward finishes. Buyers there ask for matte black, champagne, and two-tone options. Tier 2 and Tier 3 cities like Da Nang, Can Tho, and Hai Phong still favor classic brushed silver and satin finishes because those pair with more traditional furniture lines. When you build your inventory plan, split your finish allocation by region.
How Urbanization Shapes Finish Preferences
Vietnam's furniture market 7 is projected to grow from roughly USD 2.45 billion in 2024 toward USD 5.02 billion by 2030 in some estimates, with a CAGR in the range of 5.6% to 9.5% depending on the report scope. More importantly for handle sourcing, this growth is concentrated in urban areas where apartment living demands compact, modern furniture with sleek hardware. That means the demand curve favors clean, contemporary finishes over ornate or traditional ones.
What specific sales metrics should I track to ensure I don't face stockouts or overstocking during peak seasons?
On our production floor, we see a predictable rush every year around September through November as Vietnamese buyers prepare for the Lunar New Year 8 construction and renovation cycle. The buyers who placed data-informed orders in August rarely face problems. The ones who guessed often end up either scrambling for air freight or stuck with excess inventory in March.
Track inventory turnover rate by SKU, days of supply on hand, sell-through rate by finish and style, reorder point triggers, and seasonal demand indices. These five metrics together give you a clear signal for when to reorder, how much to hold, and which styles to phase out before they become dead stock.

The Five Core Metrics Explained
Let me walk through each metric and why it matters for aluminum handle sourcing specifically.
1. Inventory Turnover Rate by SKU. This tells you how many times you sell and replace a specific handle style in a given period. A high turnover rate means strong demand. A low rate means the style is sitting. Calculate it as: Cost of Goods Sold ÷ Average Inventory Value for that SKU.
2. Days of Supply (DOS). This shows how many days your current stock will last at the current sales pace. For handles with a 15-day shipping time from China, you need at least 20-25 DOS as a buffer. For custom orders with a 7-day production window plus shipping, plan for 30+ DOS.
3. Sell-Through Rate. This is the percentage of inventory sold within a set time frame. A healthy sell-through for a standard aluminum handle finish should be above 60% within 30 days. Below 40% signals a problem.
4. Reorder Point (ROP). Set a trigger level for each SKU. When inventory drops to this number, you place a new order automatically. The formula is: (Average Daily Sales × Lead Time in Days) + Safety Stock.
5. Seasonal Demand Index. Build an index that compares each month's sales to the annual average. If October sales are typically 1.8x the annual monthly average, your index for October is 1.8. Use this to scale your orders ahead of peak months.
Seasonal Demand Calendar for Vietnamese Handle Sourcing
| Period | Demand Level | Key Driver | Recommended Action |
|---|---|---|---|
| Jan-Feb (Tet) | High | Lunar New Year renovation completions | Stock should already be in warehouse |
| Mar-Apr | Low-Medium | Post-Tet slowdown | Review slow movers, clear excess |
| May-Jun | Medium | Mid-year construction starts | Place orders for Q3 stock |
| Jul-Aug | Medium-High | Pre-peak preparation | Confirm custom orders, top up stock items |
| Sep-Nov | High | Peak construction and renovation season | Maximize ready-to-ship inventory |
| December | Medium | Year-end projects wrapping up | Begin planning Q1 allocation |
How to Avoid the Two Biggest Mistakes
The first mistake is overstocking a trendy finish that peaks fast and drops. Matte black is popular now, but if you order 12 months of supply at once, you risk holding dead stock if the trend shifts. Order in smaller, more frequent batches instead. Our 48-hour shipping for stock items and 3-7 day turnaround for custom products exist precisely to support this kind of lean ordering.
The second mistake is ignoring long-tail SKUs. Some handle styles sell slowly but consistently. They serve a niche, like recessed handles for commercial office furniture. If you cut them from inventory, you lose those loyal repeat buyers. Track their sell-through rate 9 separately and keep a small safety stock.
Building a Simple Tracking Dashboard
You do not need expensive software. A well-structured spreadsheet works. Create columns for SKU, finish, style family, monthly units sold, current stock level, DOS, sell-through rate, and ROP. Update it weekly. Color-code items that fall below their reorder point 10 in red. This simple system catches problems before they become costly.
How can I use my supplier's R&D and export data to predict which new handle styles will succeed in my market?
When our R&D team develops a new recessed handle profile or tests a new anodized finish, we do not just design in a vacuum. We look at what is selling across our export markets, what buyers are requesting in sample orders, and what competitors are introducing. That data is available to you too, if you know how to ask for it.
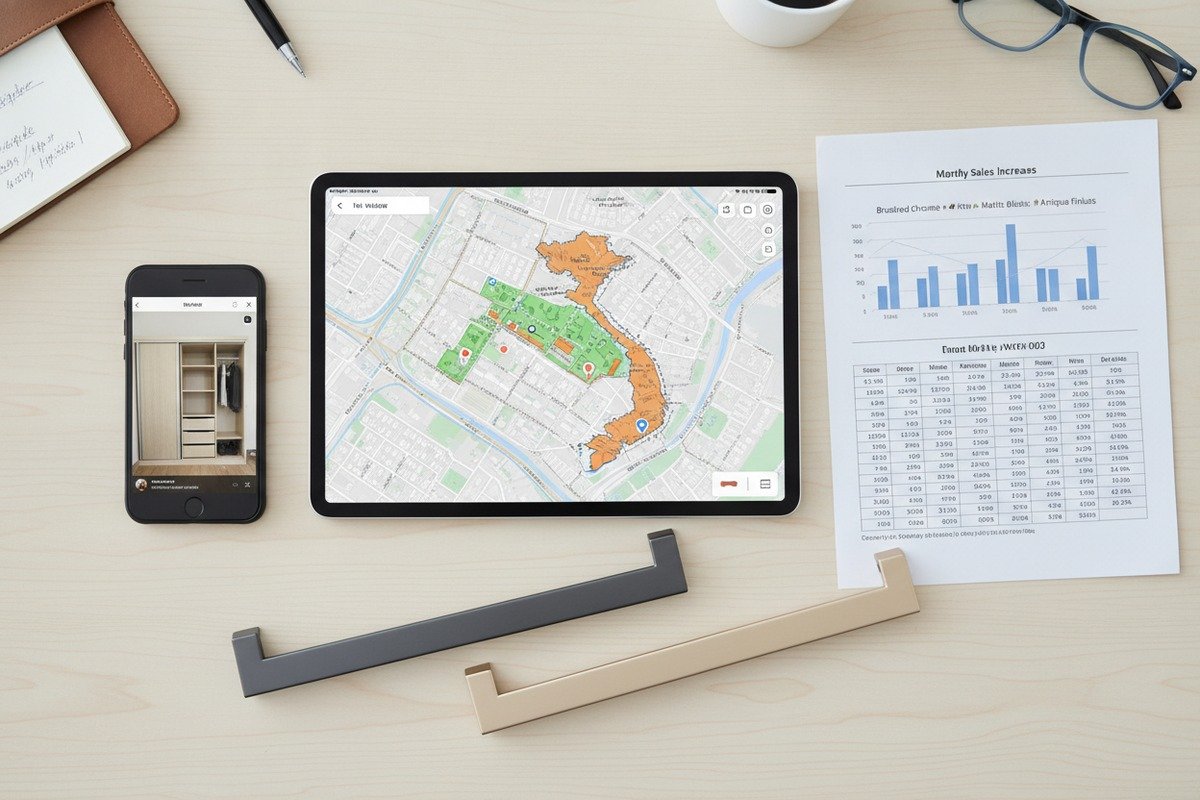
Request your supplier's data on new product sample request volumes, export shipment trends by style and destination, R&D pipeline timelines, and quote-to-order conversion rates for new designs. These signals reveal which upcoming styles have real market traction before they show up in your competitors' catalogs.
What Supplier Data Actually Tells You
Most buyers only ask their supplier for a price list and a catalog. That is a missed opportunity. A good manufacturing partner tracks far more useful information. Here is what to request and what it means:
Key Supplier Data Points and Their Meaning
| Data Point | What It Reveals | How to Use It |
|---|---|---|
| Sample request volume by style | Which new designs are getting attention from multiple buyers | High sample volume = rising interest; consider early ordering |
| Export data by destination | Which styles are shipping to markets similar to yours | If a style sells well in Thailand or Indonesia, it may work in Vietnam |
| Quote-to-order conversion rate | Which styles move from inquiry to actual purchase | High conversion = validated demand, not just curiosity |
| R&D pipeline timeline | When new finishes or profiles will be production-ready | Align your product launch calendar with supplier readiness |
| Reorder rates for new styles | Whether first-time buyers come back for more | High reorder = proven product-market fit |
How to Have the Right Conversation With Your Supplier
Do not simply ask "What's new?" Instead, ask specific questions. "Which three new handle styles received the most sample requests last quarter?" "What percentage of first-time buyers for your new champagne gold recessed handle placed a second order?" "Which styles are you shipping the most to Southeast Asian markets right now?"
At our facility in Foshan, we keep these numbers because they help us plan production runs. When a buyer asks us for this kind of data, we are happy to share it because it leads to better-aligned orders and fewer returns.
Cross-Market Validation
Vietnam does not exist in a sourcing vacuum. Styles that gain traction in similar Southeast Asian markets often cross over. If a minimalist edge pull in matte black is trending in Indonesian apartment projects, there is a reasonable chance it will appeal to Vietnamese buyers facing similar urbanization and compact-living conditions. Ask your supplier which styles are growing fastest in comparable markets.
Timing Your Adoption of New Styles
Not every new style deserves a large order. Start with a test batch. Order 50-100 pieces of a new finish or profile. Track sell-through over 30-60 days. If it clears at a rate above your average, scale up. If not, you have limited exposure. This test-and-learn approach, combined with supplier R&D data, reduces the risk of betting big on the wrong style.
Why Export Data Beats Guesswork
Vietnam's kitchen furniture market alone is projected to reach around USD 401 million by 2031, with metal as the fastest-growing material segment at roughly 4.17% CAGR. That growth creates space for new aluminum handle styles. But which styles? Export data from your supplier shows real purchasing behavior, not just market projections. It tells you what actual buyers in real markets are spending money on right now. That is always more reliable than a trend report.
What data-driven methods can I use to balance my demand for custom OEM designs versus ready-to-ship stock items?
One of the most common decisions we help our Vietnamese buyers make is this: how much of your budget should go to custom OEM handles versus our ready-to-ship stock? The answer is not a fixed ratio. It depends on your customer mix, your cash flow, and the data you collect on how each category performs.
Balance custom OEM and stock handle sourcing by analyzing your order data along three dimensions: lead time sensitivity of your customers, margin difference between custom and stock items, and the sell-through velocity of each category. Use a portfolio approach where stock items cover base demand and custom OEM serves differentiated, higher-margin segments.
Understanding the Trade-Off
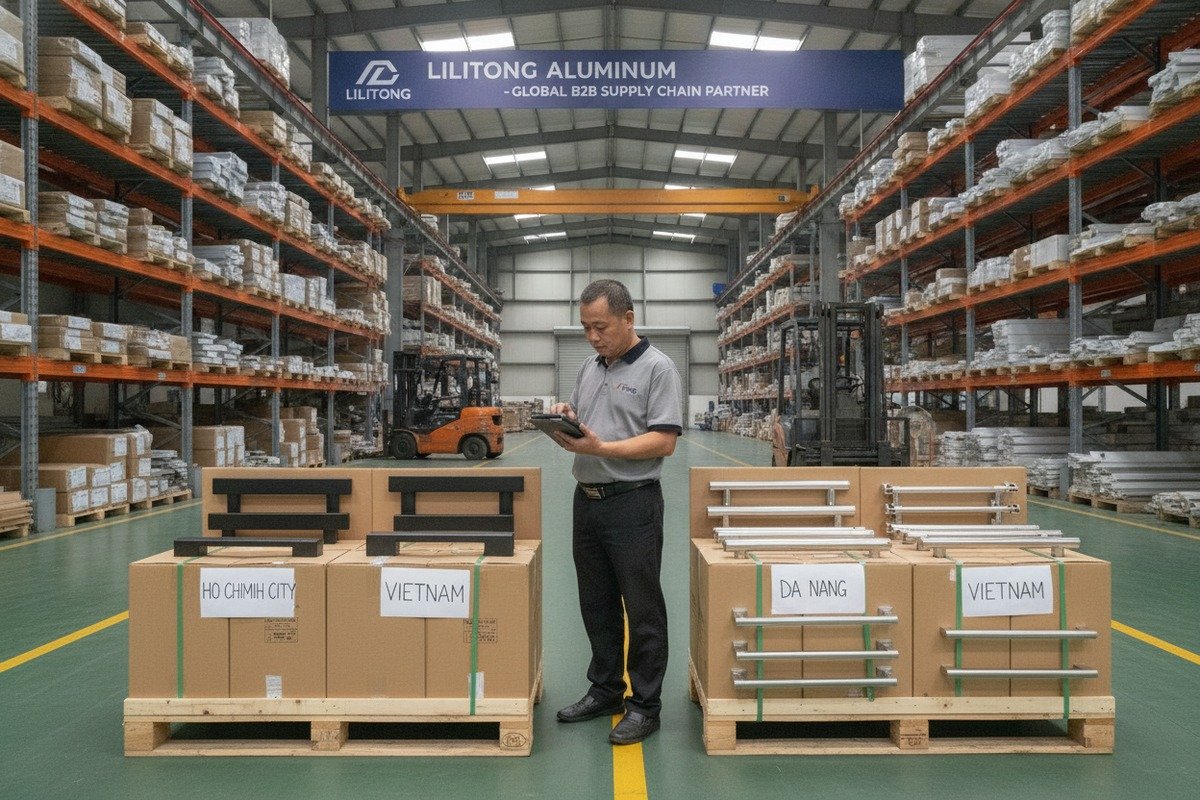
Stock items ship fast. From our 300-ton inventory in Foshan, we can dispatch within 48 hours. That speed is perfect for distributors who need to fill urgent orders or maintain a steady supply of popular styles. But stock items are available to everyone, including your competitors.
Custom OEM designs take longer, typically 3-7 days for production in our facility, plus shipping. But they give you exclusivity. A unique finish, a proprietary profile, or a custom length means your competitor cannot offer the exact same product. The margin is usually higher too.
A Framework for Deciding Your Mix
Here is a practical decision matrix:
| Factor | Favors Stock Items | Favors Custom OEM |
|---|---|---|
| Customer need for fast delivery | ✔ | |
| Desire for product differentiation | ✔ | |
| Budget constraints and cash flow | ✔ | |
| Higher margin opportunity | ✔ | |
| Unpredictable demand patterns | ✔ | |
| Stable, repeat project orders | ✔ | |
| New market entry (testing phase) | ✔ | |
| Established customer relationships | ✔ |
How to Use Your Sales Data
Pull your last 12 months of orders. Separate them into stock and custom categories. Calculate the following for each:
- Average margin per unit. Custom OEM handles typically yield 15-30% higher margins than stock equivalents.
- Lead time complaints. How often did customers complain about waiting? If lead time complaints concentrate on custom orders, you may need to shift more volume to stock.
- Reorder frequency. Do custom OEM buyers reorder more consistently? That suggests the differentiation is working and justifies the longer lead time.
- Cancellation rate. Custom orders sometimes get cancelled if the buyer's own project falls through. Track this rate. If it is above 5%, tighten your custom order policies.
The 70/30 Starting Point
For buyers entering or growing in the Vietnamese market, a common starting ratio is 70% stock, 30% custom. As you build customer relationships and understand local taste, you can shift toward 60/40 or even 50/50. The key is to let the data guide the shift, not assumptions.
Cluster Analysis for Customer Segmentation
A more advanced technique is to group your customers into clusters based on their buying behavior. One cluster might be price-driven distributors who want stock items with fast delivery. Another cluster might be furniture factories building branded products who need custom profiles and exclusive finishes. A third might be project buyers who order in bulk for specific developments and value design support.
Assign each cluster a sourcing strategy. Stock-heavy for the first group. Custom-heavy for the second. A balanced mix for the third. This segmentation approach ensures your sourcing decisions match actual customer needs rather than a one-size-fits-all ratio.
Validating Your Balance Over Time
Review your stock-to-custom ratio every quarter. If custom OEM orders are growing faster as a percentage of your total, that is a sign the Vietnamese market is maturing and buyers want more differentiation. If stock orders are growing faster, it may mean price competition is intensifying and speed matters more than uniqueness. Either way, the data tells you where to invest.
Conclusion
Data-driven demand forecasting is not a luxury for aluminum handle sourcing in Vietnam. It is a practical necessity. By combining market trend analysis, precise sales metrics, supplier intelligence, and a balanced stock-to-custom strategy, you turn guesswork into a sourcing advantage that protects your margins and keeps your inventory moving.
Footnotes
1. Replaced with World Bank Open Data for Vietnam’s urban population percentage, an authoritative source for urbanization rates. ↩︎
2. Offers detailed analysis and growth forecasts for the Vietnam furniture market. ↩︎
3. Provides current rankings and traffic analysis of leading e-commerce platforms in Vietnam. ↩︎
4. Discusses the booming residential and commercial real estate market driving demand. ↩︎
5. Explains the definition, formula, and importance of the inventory turnover ratio. ↩︎
6. Defines Inventory Days of Supply and provides its calculation formula. ↩︎
7. Provides current market size and future growth projections for the furniture market. ↩︎
8. Replaced with the Wikipedia page for Tết (Vietnamese Lunar New Year), an authoritative and comprehensive source for information on the holiday. ↩︎
9. Explains the sell-through rate, its formula, and its importance in retail. ↩︎
10. Details the reorder point formula and its components for inventory management. ↩︎